Debugging Tools
- Nick Simone
Network Tab
The network tabs provides information on what the browser is doing on the network layer. It will show you all the individual files and requests that a single webpage is making. This includes every script and image that your browser downloads to render the webpage.
This is extremely useful for debugging Songbird because it provides the direct communication between Songbird and Centinel API. You can see what Songbird sent to Centinel API and how Centinel API responded.
Network tab empty?
You may need to refresh the page if the network tab is empty. The network tab will only display data when developer tools is open.
The below image shows Songbird sending a request to Centinel API. Notice that there are 2 requests with the same endpoint. This is because Songbird uses CORS to communicate with Centinel API. CORS requires a preflight request prior to posting data to a CORS endpoint.
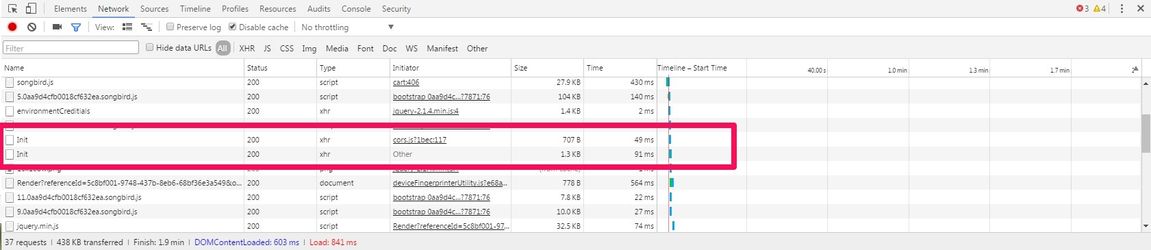
This preflight request is just an exchange of HTTP headers to see if the server sends back the correct CORS headers that indicates that the server supports a CORS posts. A preflight request will have a Request Method of "OPTIONS" as seen below.
in the response section you can see what the server supports through CORS with the Access-Control-Allow-Methods section. For the purpose of complete documentation we're looking for this section to have GET, POST and OPTIONS at minimal for Cardinal Cruise to work. This section shouldn't ever change, and from a support perspective you shouldn't have to pay attention to the preflight request other than seeing that it was made successfully. An erroneous preflight request would not return 'Status Code: 200 OK'.

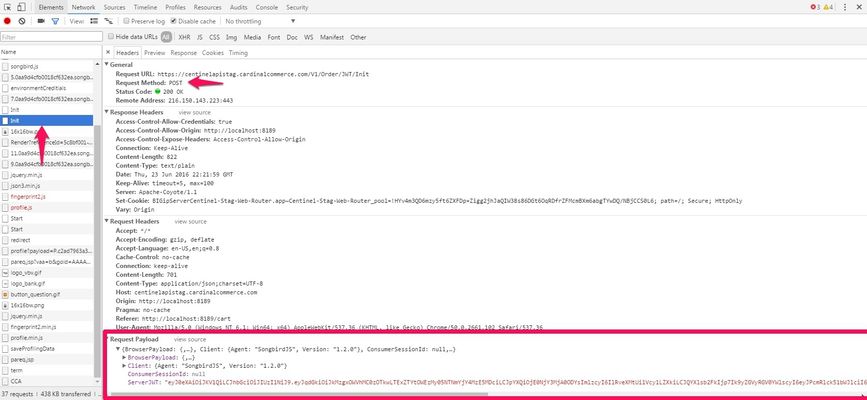
To review the data exchanged between servers select the 2nd request. This is where data is actually posted back and forth. In the below example you can see the 2nd request is using a Request Method of "POST" and contains a Request Payload. The Request Payload is the actual data sent to Centinel API. From here you can see the JWT the merchant created and any data they passed through the Browser.
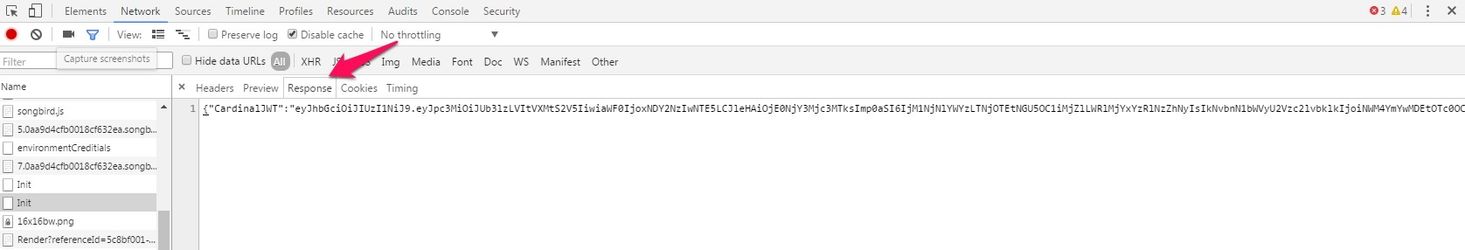
To view the response select the "Response" tab as denoted below.
Console Tab
The console tab within the developer tools is a console that allows you to run JavaScript commands within the current page and view any JavaScript debugging messages. This area will also display any run time warnings or errors that your JavaScript code encounters.
For more in depth documentation related to the developer console refer to Google Chome's documentation.
JavaScript Console Messaging
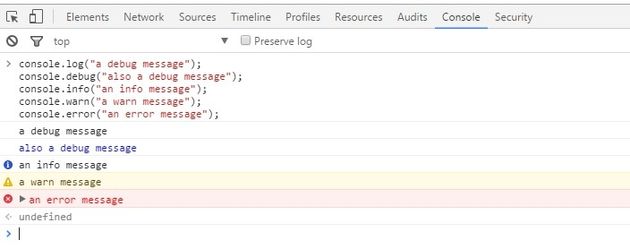
console.log("a debug message");
console.debug("also a debug message");
console.info("an info message");
console.warn("a warn message");
console.error("an error message");
Will out put the following in console
You can use this to output debugging information while in development. It is strongly recommended that these are not used in production. It can leak state information that you may not want extremely easily accessible and may cause errors to occur in the older browsers that don't support console (generally older IEs).
Run Commands
The Basics
The console also lets you execute JavaScript directly on the page you're currently on. You have complete access to the current state of the javascript engine. This means you can mutate behavior like event listeners, global values, and more. To write code to the console, simply click the bottom line with the '>' next to it. You can than start typing in JavaScript code to execute like below

When you press enter the JavaScript code will execute as seen below. Notice that it outputs '<- undefined' after the line I entered. If this command had a return value, the return value would have been output. Since setting a variable doesn't have a return undefined is output.

We can than use console.log to output the current value of myTestObject directly to console

which will output

Apply this to debugging
You can apply this principle to debugging an integration by manually trigger different songbird events. You will be able to run any JavaScript command used within the Songbird integration directly in the console. For example you could manually fire the Cardinal.start() funciton to test if there is an issue with the code triggering the CCA flow.
Note
You may need to include object data with the start command depending on your integration
Cardinal.start('cca');